Fixing Performance Issues: An Example
By Mabel
1. Introduction
A warning: This is going to be a technical post, so if you're not interested in programming, you can probably skip this one. A few of you are aspiring programmers, and this is for you guys. I'm going to walk through the process of finding and fixing a particularly irritating performance issue.
Legions is made up of about 800k lines of C++ code, 20k lines of TorqueScript (a slow and simple C-like scripting language), and a few scattered lines of Assembly. The game is controlled mostly by TorqueScript and leaves the heavy lifting to C++.
2. Identifying the Problem
In order to fix something, we need to be able to identify a reproduction case (or repro case for short). If we don't know when a problem happens, good luck finding out how to fix it.
Now that we know what we need to do, let's chase the bug. While playing a pickup, I noticed more of a certain kind of stutter than usual. This was an instant red flag: Anomalies usually happen for a reason, so what was different this match? One of the captains had decided to use the (particularly ridiculous) strategy of having three or four Sentinels on defense. What's so special about the Sentinel?
Cluster grenades of course! To try to fix the problem, I SSHed into the server and executed the following in the game's interactive interpreter:
![]()
A minute later (now that everybody has respawned and nobody has clusters grenades, just the normal grenade launcher), the server mysteriously started behaving better. Brilliant! Now we know exactly what to chase.
3. Fixing the Problem
The Torque engine has an instrumented profiler. Unfortunately, it's difficult to use and poorly instrumented (so it doesn't give us nearly enough information). Luckily for us, the fact that the game simulation is almost entirely single-threaded means we can use unsophisticated (and free!) single-threaded profilers like Very Sleepy. If we needed a multithreaded profiler I'd have to use something like VTune, but we don't.
The next step is to identify what part of the code is causing the game to lag. Since the problem could be either client-side or server-side (we don't know yet!), we'll start up a listen server so we can get both at once.
To make sure the problem actually happens, let's amplify the cluster a little bit...
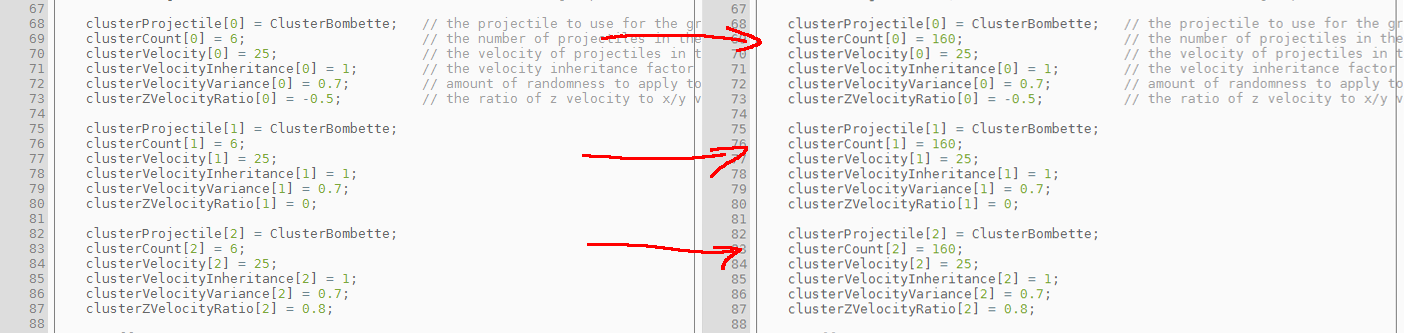
and then see what happens...
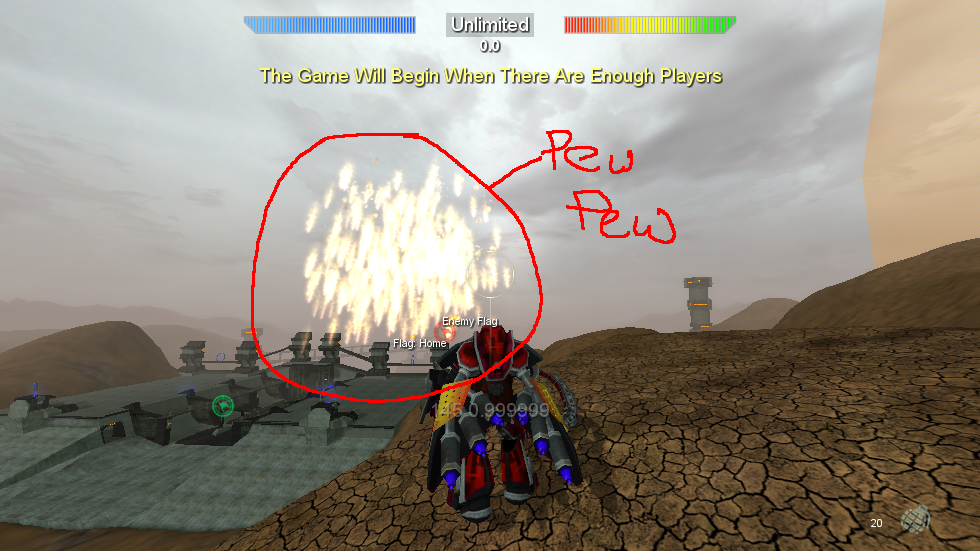
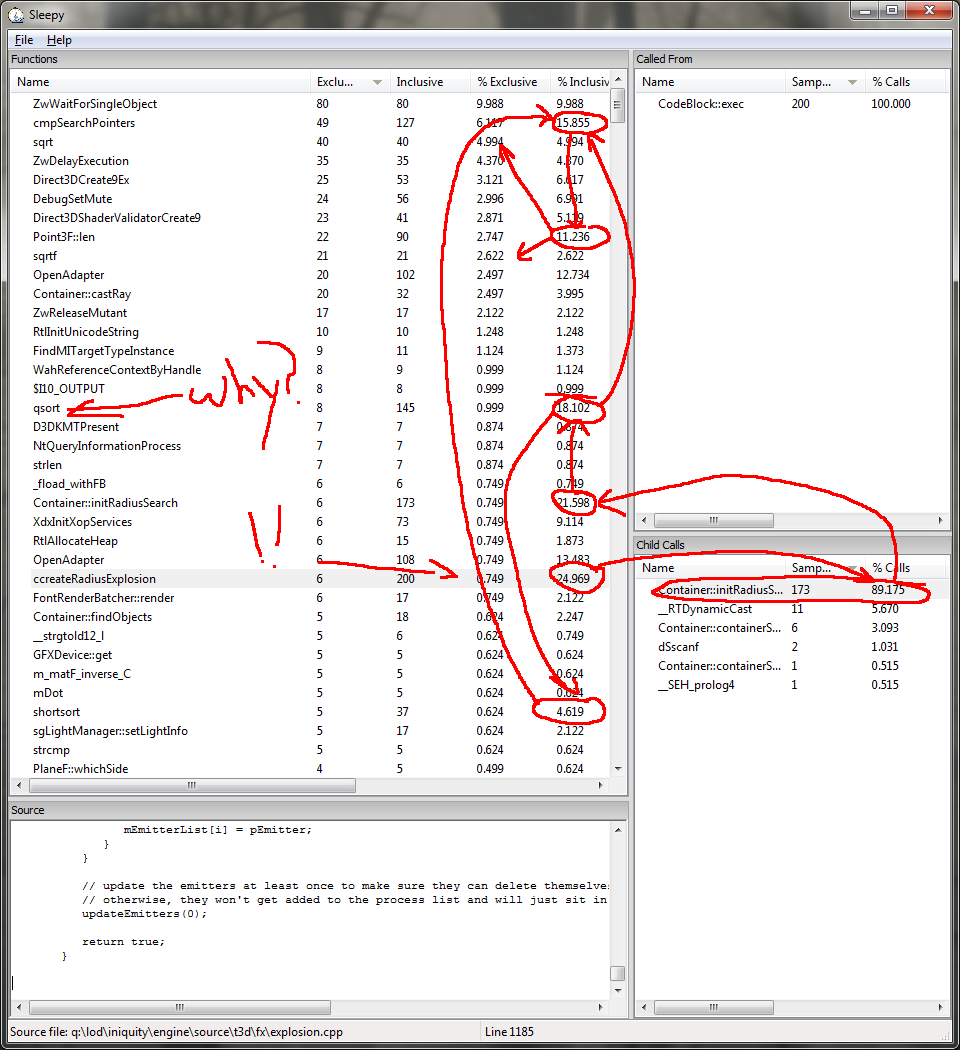
Let's profile the problem. My game actually stalled for 10+ seconds while processing this enormous lag monster. That's a good thing, though. Since the profiler will tell me how much time is being taken in all the code, it's a bit fiddly to try and isolate one problem unless you can make it a significant amount of time. Now that we've captured the CPU activity during that lag, let's see what's taking so...
Oh. My. God.
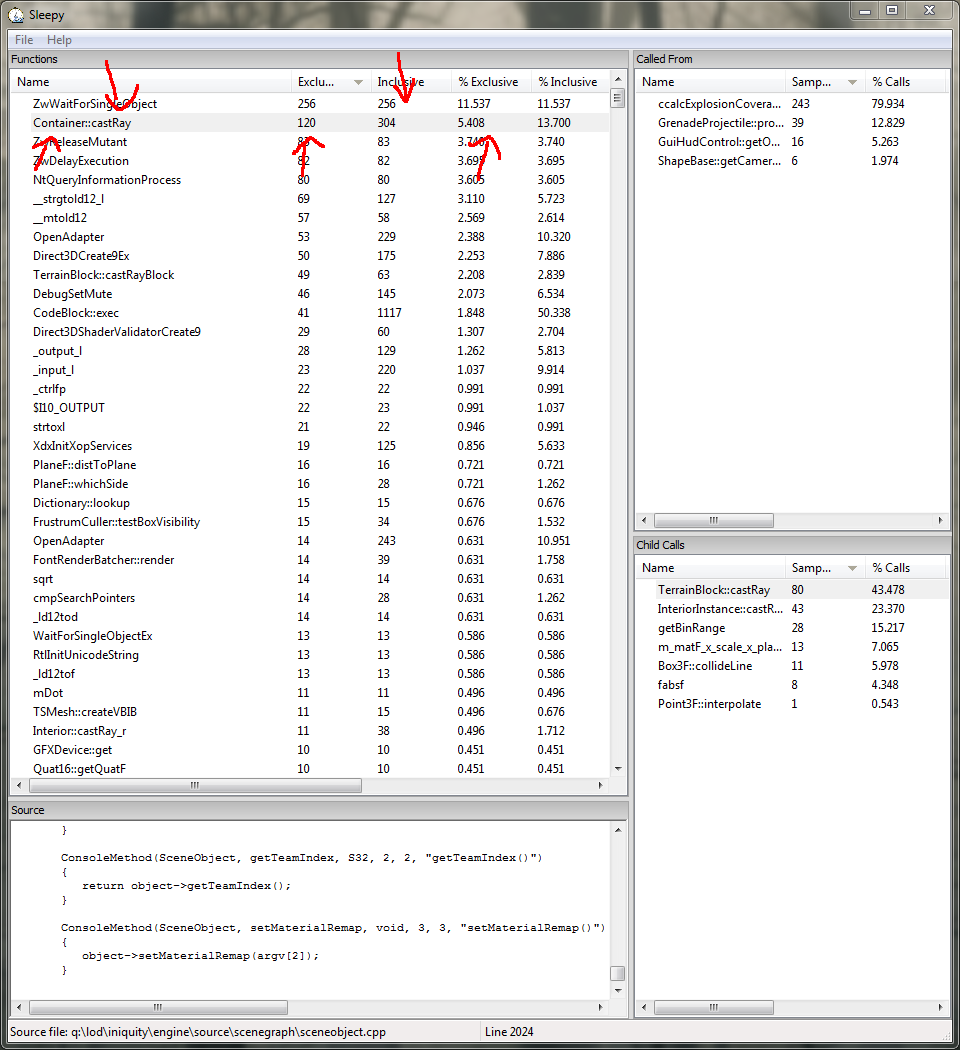
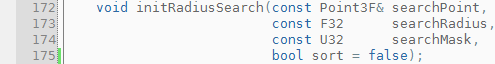
That's a lot of time. The game is taking ages casting rays. But why? Taking a look at the top of the "Called From" list, we see that 80% of the calls are coming from inside ccalcExplosionCoverage. Functions prefixed with a "c" like that are generated in a macro that helps create console functions, so let's check the script to see how this is called.
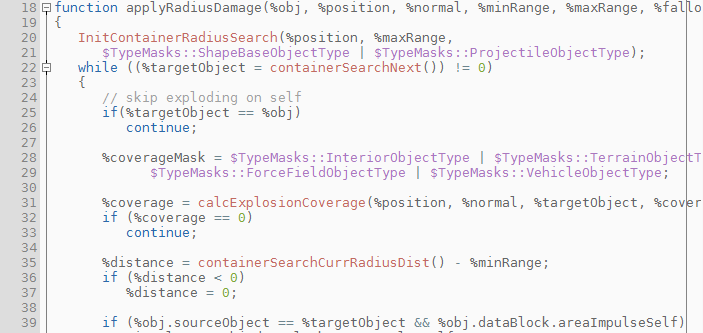
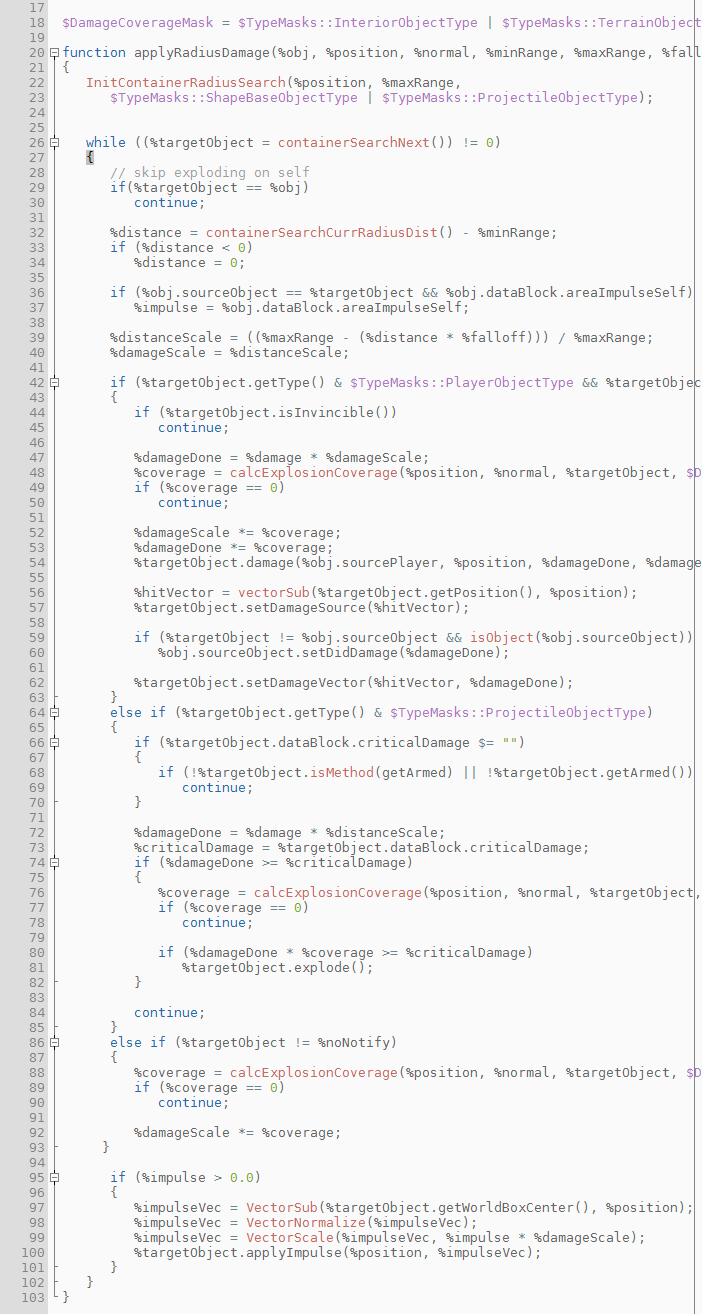
Oh, how lovely, this is an easy one. Let's break this down: We start a container search for objects in range, and we filter by type. One problem -- calcExplosionCoverage is an expensive function call and it's not necessary to do it all the time. This function does a bit of testing to see if the object is occluded or not. This is a necessary step, but only when you're actually going to apply damage. So let's try and eliminate as many cases as possible before we do the coverage check.
We need to do damage in two cases. The first is when we're shooting either a ShapeBase object (Flags and Players) or an armed cluster grenade. Good -- these are checks that can easily be done. Let's rearrange that a bit.
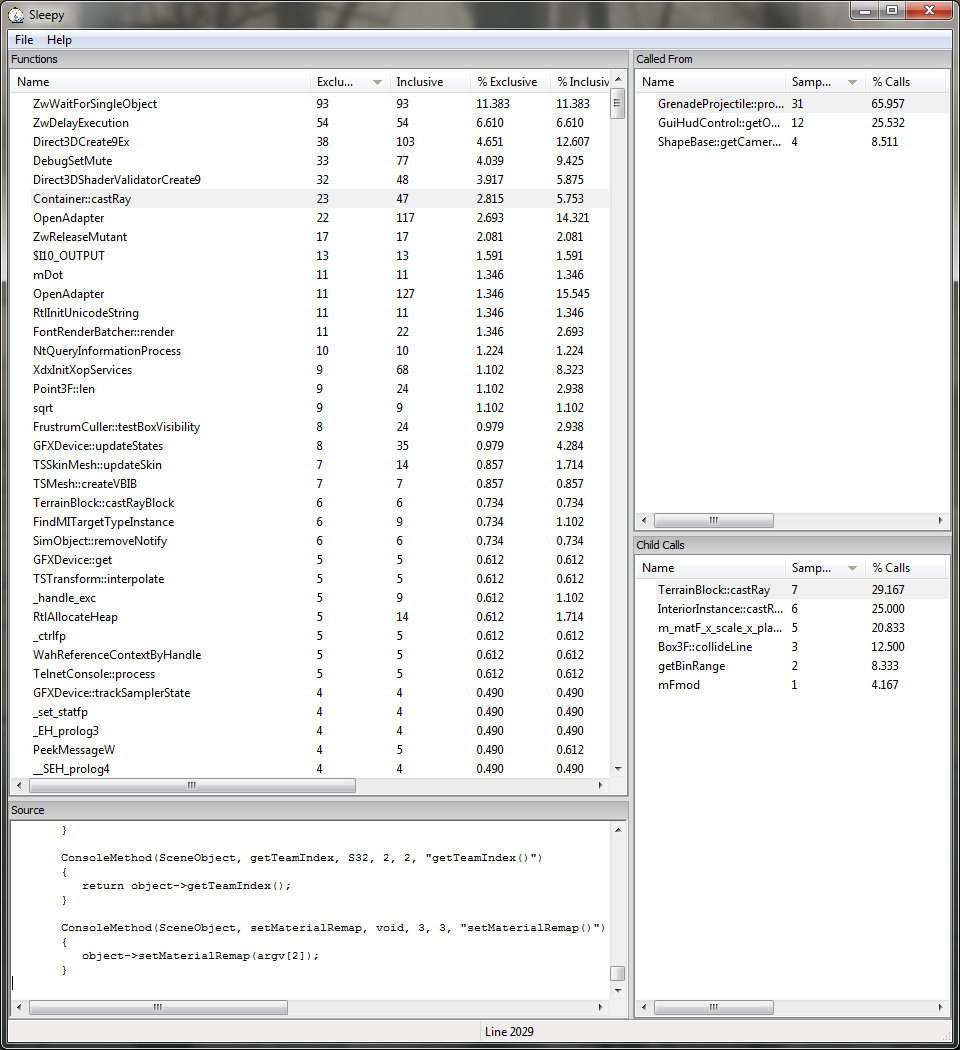
Okay! We just took an ubercluster down from six to three seconds by simply rearranging the code so it executes less often! Let's take a look at the profiler again.
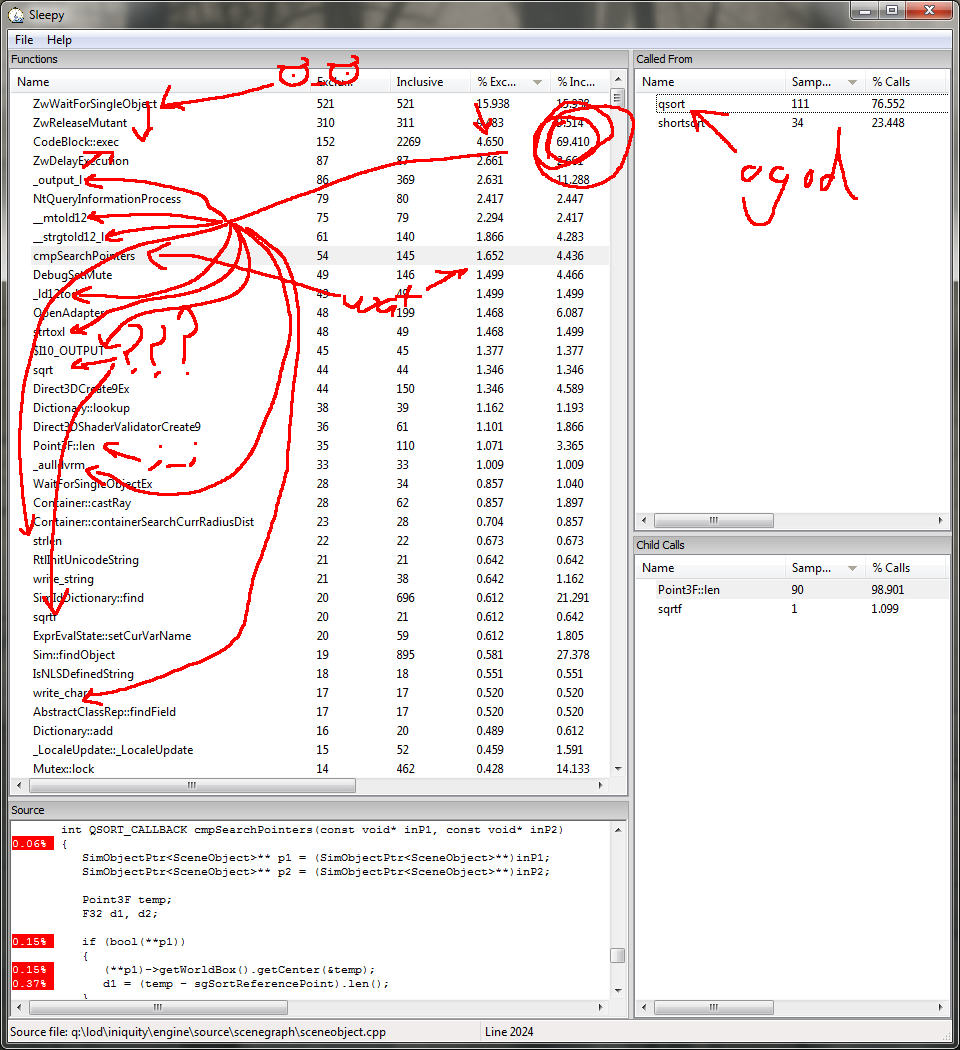
There's a lot of information here, and most of it is painful. There are a few very telling points, though: First, you can see CodeBlock::exec is taking up almost 70% of the CPU time during this lag. Omigawd. Given the sheer volume of the query, using script at all has become the main bottleneck on performance. We can see all sorts of standard library functions rocking the top of this chart sucking down huge amounts of CPU time. A quick inspection of these functions reveals that they are all string operations. The scripting language actually stores all values as strings, then bounces them to and from CPU native values using atof, sprintf, strtol and a bunch of others I'm sure I've missed.
Wait a minute....
Fo reelz. Looks like to speed this up, we're going to need to bring this into C++. Let's do that now.
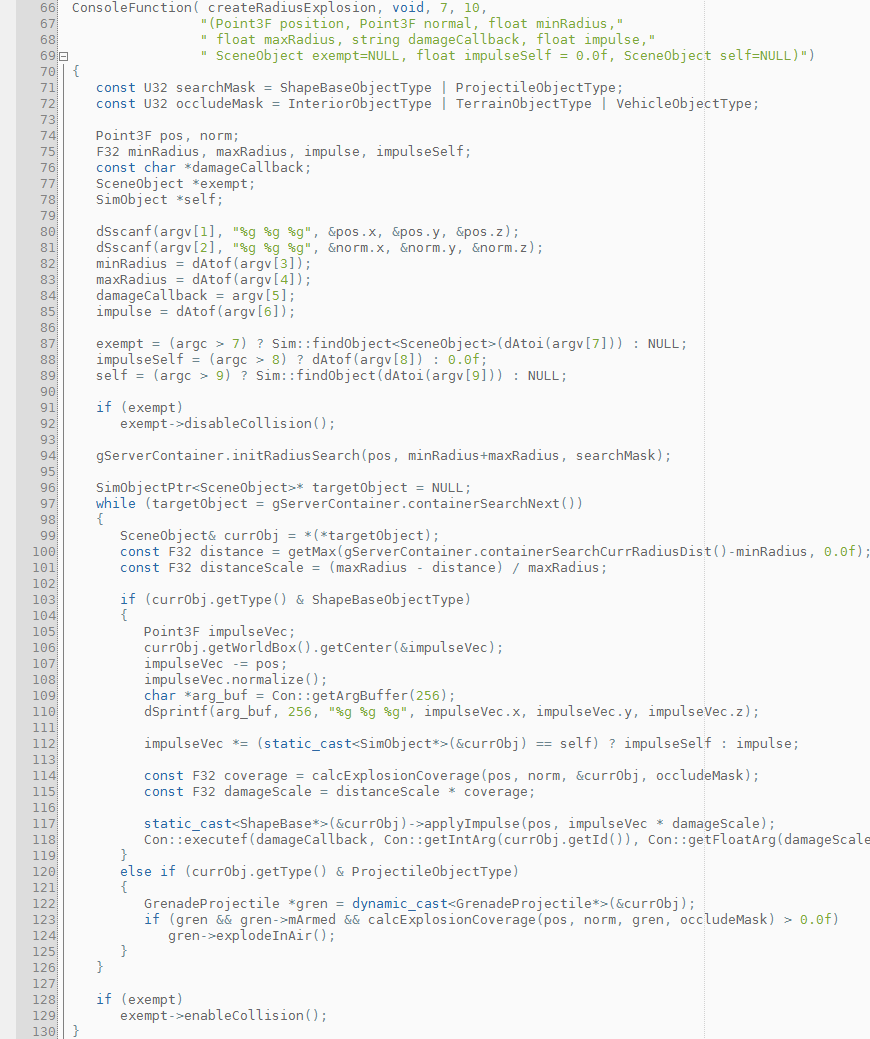
Much cleaner! I found it interesting that the C++ function is much easier to read than the TorqueScript function (even with all that ugly code to convert to and from strings!). It's also a whopping 6x faster. The ubercluster now takes less than a second to resolve and takes the same time to resolve a 480-explosion cluster as it took to resolve a 16-explosion cluster. Nice. Let's take another look at the profiler.
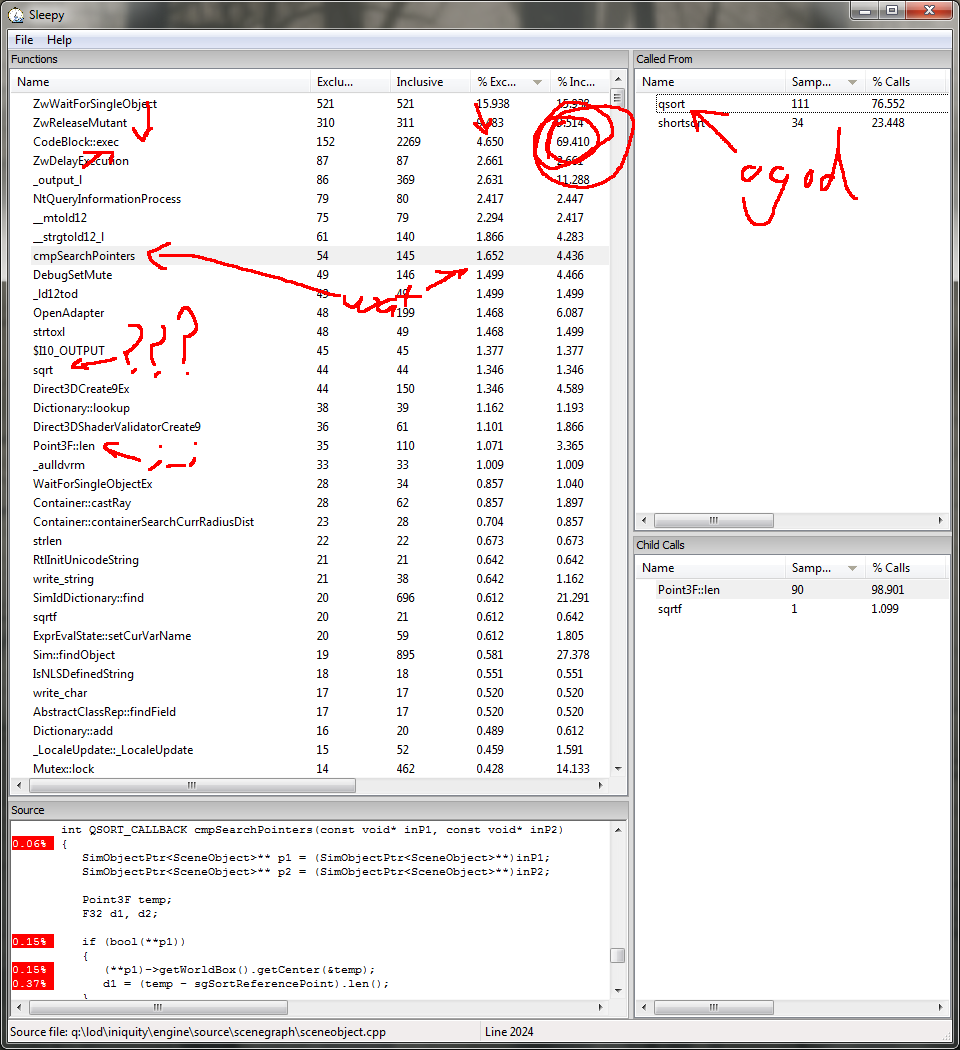
Alright! Switching over to native code has cut down our execution time immensely and evened out the profile a lot. We still have one particularly pointless and nasty function: the quicksort. We can see it's doing lots of vector length operations, which is another red flag, since calculating vector length is an expensive operation (it needs a square root). Fortunately for us, it's rarely necessary. Vector length can be thought of as the Pythagorean Theorem generalized to n-dimensions (n in this case is 3). So x^2 + y^2 + z^2 = magnitude^2. While we can obviously use the magnitude (and incur the wrath of the sqrt) we can (slightly less obviously) use the squared magnitude for fast comparisons. So we avoid the entire nasty function.
This is one of the easiest, most common optimizations you should never forget to perform, and the fact that this code originally didn't is rather mind boggling. Fortunately, we have an even better one.
Don't do it. We don't need to sort the list at all. None of the code assumes the list is sorted, so we're just transforming data for no good reason. Let's take care of that now.
We introduce a new parameter which will sort the search results. None of the other code that calls this functions assumes we iterate through them in any particular order, but we add this in case they need to. We also perform the lenSquared optimization to speed up the sort. No reason to leave a minefield for other people. And let's check the profile one last time...
Close enough for jazz.